
North Norfolk Retains Crown for Highest Outright Home Ownership in England
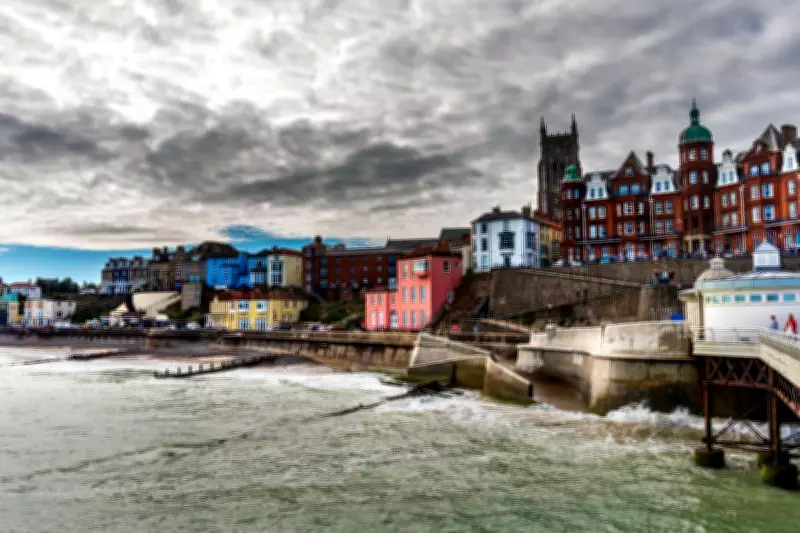
Newly released figures from the Office for National Statistics (ONS) confirm that North Norfolk remains the local authority in England with the greatest proportion of properties owned outright by their occupants. This picturesque coastal district, encompassing the seaside towns of Cromer and Sheringham, has consistently held this top position, reflecting a distinctive demographic and housing trend.
Coastal and Rural Areas Dominate the Rankings
According to the latest estimates of household tenure for 2024, a striking 49.9% of all types of accommodation in North Norfolk are owned in full, meaning residents have no outstanding mortgage repayments or debts. This marks a slight increase from 49.8% in 2023. The data underscores a broader pattern where areas with the highest percentage of outright home ownership tend to be located in coastal regions or away from major urban centres.
The top five local authorities for outright ownership are:

- North Norfolk (49.9%)
- Rother in East Sussex (48.7%)
- Staffordshire Moorlands (48.3%)
- Derbyshire Dales (48.2%)
- East Lindsey in Lincolnshire (47.4%)
Notably, three of these—North Norfolk, Rother, and East Lindsey—are also among the local authorities with the largest proportion of residents aged 65 and over, suggesting a correlation between older demographics and mortgage-free living. The rankings in both the top and bottom five remain unchanged from the previous year, indicating stable regional disparities.
London Boroughs Show Lowest Outright Ownership Rates
In stark contrast, the areas with the lowest percentage of properties owned outright are all concentrated in London, highlighting the capital's unique housing market dynamics. The bottom five are:
- Tower Hamlets (8.4%)
- Hackney (10.1%)
- Southwark (11.0%)
- Islington (12.0%)
- Lambeth (12.1%)
This urban-rural divide is further emphasised by the distribution of other tenure types. For privately rented properties, the top five areas are all in London, led by the City of London with 51.6% of all accommodation. Conversely, the bottom five for private renting are outside cities and away from heavily built-up areas, such as North East Derbyshire at 10.2%.
Broader Housing Trends Across England
The ONS figures reveal that in 2024, there were 24.0 million households in England residing in 25.6 million dwellings, up from 23.7 million households and 25.4 million dwellings in 2023. A household includes individuals living alone or groups at the same address, providing a comprehensive view of housing occupancy.
Of the 25.6 million dwellings in 2024, the breakdown of tenure types is as follows:
- 8.4 million (32.7%) were owned outright
- 7.7 million (29.9%) were owned with a mortgage or loan
- 5.3 million (20.7%) were privately rented
- 4.3 million (16.7%) were social rents, primarily from housing associations and local authorities
For properties owned with a mortgage or loan, Wokingham in Berkshire leads with 42.4%, followed by Dartford in Kent at 41.5%. The lowest proportions for this category are again found in London, with Westminster at 13.4%. In terms of social rents, the top five areas are all in the capital, with Islington highest at 38.4%, while the bottom five include Castle Point in Essex at 5.4%.
These statistics highlight the complex interplay between geography, demographics, and housing policy in England, with coastal and rural areas like North Norfolk continuing to exemplify higher rates of outright home ownership amidst a national landscape of diverse tenure patterns.