
New official statistics have confirmed that North Norfolk remains the local authority in England with the highest proportion of properties owned outright by their occupants. According to the latest estimates from the Office for National Statistics (ONS), nearly half of all accommodation in this East Anglian coastal district is owned in full, meaning residents have no outstanding mortgage repayments or debts.
Coastal and Rural Areas Dominate Top Rankings
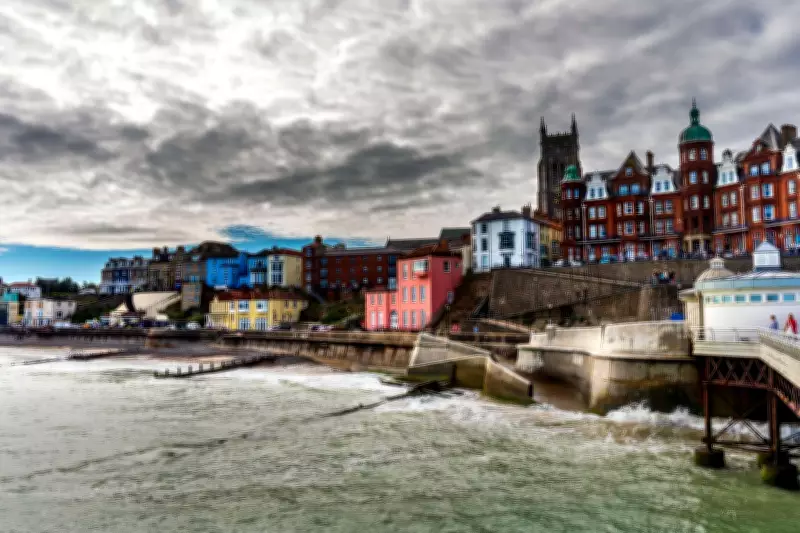
The data, published as part of the ONS household tenure estimates for 2024, shows that 49.9% of properties in North Norfolk were owned outright, a slight increase from 49.8% in 2023. This thin strip of coastline, which includes the seaside towns of Cromer and Sheringham, has consistently recorded the largest percentage of people aged 65 and over in England, a demographic factor closely linked to outright ownership.
Top Five Areas for Outright Ownership
The rankings reveal a clear pattern, with coastal and rural regions leading the way:

- North Norfolk: 49.9%
- Rother in East Sussex: 48.7%
- Staffordshire Moorlands: 48.3%
- Derbyshire Dales: 48.2%
- East Lindsey in Lincolnshire: 47.4%
Notably, three of these five areas—North Norfolk, Rother, and East Lindsey—also have the greatest proportion of residents aged 65 and above, highlighting the correlation between older populations and mortgage-free home ownership.
London Boroughs Show Lowest Figures
In stark contrast, the areas with the lowest percentage of properties owned outright are all located in London, reflecting the capital's younger demographic profile and higher property prices. The bottom five rankings remain unchanged from the previous year:
- Tower Hamlets: 8.4%
- Hackney: 10.1%
- Southwark: 11.0%
- Islington: 12.0%
- Lambeth: 12.1%
This urban-rural divide underscores the broader trend that areas with the highest proportion of homes owned outright tend to be in coastal regions or away from major cities, where property markets and population structures differ significantly.
Private Rental Market Shows Opposite Pattern
The ONS figures also highlight a reverse pattern for privately rented properties. The top five areas with the largest percentage of privately rented accommodation are all in London, led by the City of London at 51.6%, followed by Westminster (47.7%), Kensington & Chelsea (42.6%), Newham (40.9%), and Tower Hamlets (40.9%). Conversely, the bottom five for private rentals are outside cities and away from heavily built-up areas, including North East Derbyshire (10.2%) and South Staffordshire (10.5%).
Household and Dwelling Numbers Increase
The data indicates a rise in the overall number of households and dwellings in England. In 2024, there were 24.0 million households living in 25.6 million dwellings, up from 23.7 million households and 25.4 million dwellings in 2023. A household is defined as people living alone or a group residing at the same address, providing a comprehensive view of housing occupancy across the country.
These statistics offer valuable insights into England's housing landscape, revealing persistent geographic and demographic trends in home ownership and rental markets. The stability in rankings from year to year suggests these patterns are deeply entrenched, influenced by factors such as age distribution, property values, and regional economic conditions.